Anomaly Detection
I spent ten weeks at the California Institute of Technology (Caltech) on a Summer Undergraduate Research Fellowship (SURF) placement, from 23rd Jun to 29th Aug 2003. My mentor was Dr. John Zweizig, who is a member of the Laser Interferometer Gravitational-Wave Observatory (LIGO) department. The title of my project was...
Gravitational Wave Bursts: Characterisation of Transients in LIGO Interferometer Data
Gravitational waves were predicted by Einstein's 1915 Theory of General Relativity, but have yet to be detected. Even the forms of gravitational waves that might be observable from the Earth are unknown. The LIGO project aims to detect gravitational waves, via interferometry. Whilst running, the two LIGO observatories generate between 3 and 6 MB/s of data, which is too much to process manually, and so software automatically identifies sections of particular interest from boring sections of background noise. One class of artifacts identified are transients — dramatic, short lived signals. My project was to design some software to automatically classify these transients and to pick out the particularly interesting ones.
A selection of previously identified transients were analysed, and based on these, various statistical procedures were considered for accurately detecting these types of transients. A novel approach for interval analysis was developed, based on best-fitting distributions to the data such that the background could take one distribution, while an interesting section was allowed to take another. This procedure was then applied to different frequencies of the interferometer data using gamma distributions, and was shown to give a good compromise between successfully detecting transients and masking out the background noise. Finally, software was written using the interval analysis procedure to characterise each transient by start time, duration, frequency composition, and statistical significance.
An Example
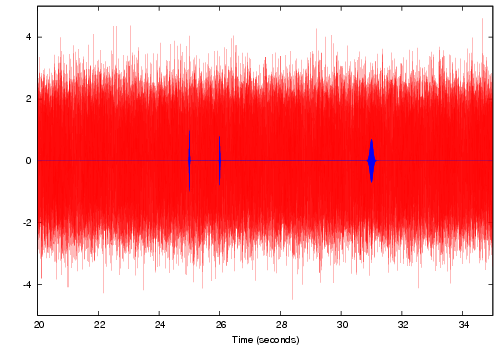
As an example, consider interesting signals to be sine waves, the amplitudes of which are gaussian. Three such signals are introduced into 60 seconds of random noisy background, distributed normally with zero mean and standard deviation 1, as shown in figure 1. The parameters for the signals are shown in table 1.

| Time | Width | Frequency | Magnitude |
| 25.0 | 0.01 | 4kHz | 1.0 |
| 26.0 | 0.01 | 4kHz | 0.8 |
| 31.0 | 0.05 | 1kHz | 0.7 |
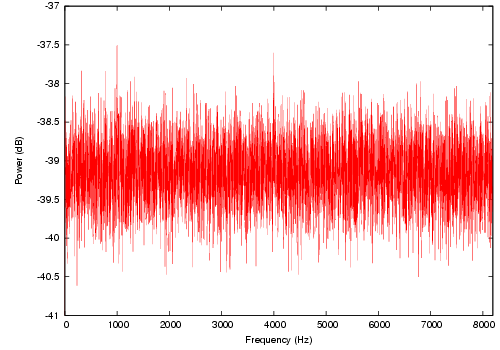
Since the signals are localised in frequency, the first obvious thing to look at is the power spectrum. This is shown in figure 2. If you look closely, there are indeed two small spikes at 1kHz and 4kHz, although they aren't significantly larger than the background noise. This is because the signals are so short that they don't contribute much power to the power spectrum.

By applying the interval analysis developed during this project, the signals are far more easily tracked down. Figure 3 shows the significance of a signal using gamma distributions, and it is abundantly obvious obvious that it has found a signal at 1kHz and 4kHz. Although not shown in figure 3, the interval analysis also picks out the correct times for the signals.

The most obvious signal found is the 1kHz one, despite it having the least amplitude. This is because it is the widest, and therefore the most statistically significant. Using the results of figure 3 successfully tracks down two of the three signals. The interval analysis is then repeated again on either side of these signals, to find any other signals present at the same frequency. By using a sensible threshold, this iterative procedure easily identifies all three signals without any false hits.
For the real LIGO data, the background noise was certainly not uniformly gaussian. It was therefore necessary to have a frequency-dependent threshold derived from the data. However, once this was done, the recursive interval analysis using a gamma distribution proved remarkably accurate.
Reports and Documentation
Various SURF reports I've worked on (in pdf format) include:
- The Project Proposal (14th Jul 2003).
- My First Progress Report (14th Jul 2003).
- My Second Progress Report (11th Aug 2003).
- A draft of my Final Report (29th Aug 2003).
The slides for my SURF presentation (given on 19th Aug 2003) can be found here, although they probably won't make much sense without the verbally given commentary.
Source Code
During my SURF project, I developed a library of interval analysis software for analysing a stream of data looking for an interval that stands out, and the application of this analysis to different frequency bands. This library was written in C, although a C++ wrapper was also written. The final results of my project, other than my final report, are two programs which are designed to work with the LIGO DMT software to automatically perform this analysis on sections of interesting data.
If you would like a copy of this source code, or further details of my project, please email me.
