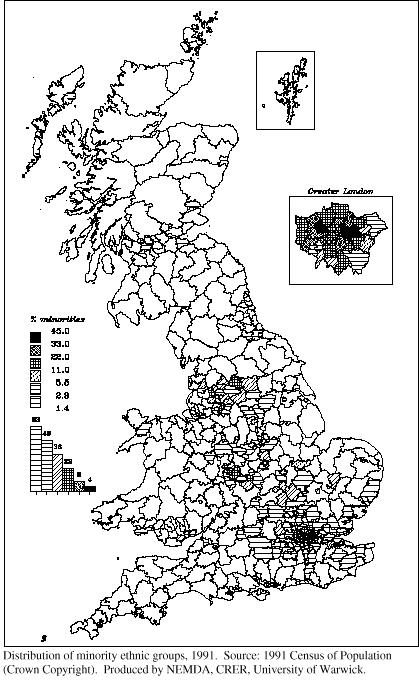
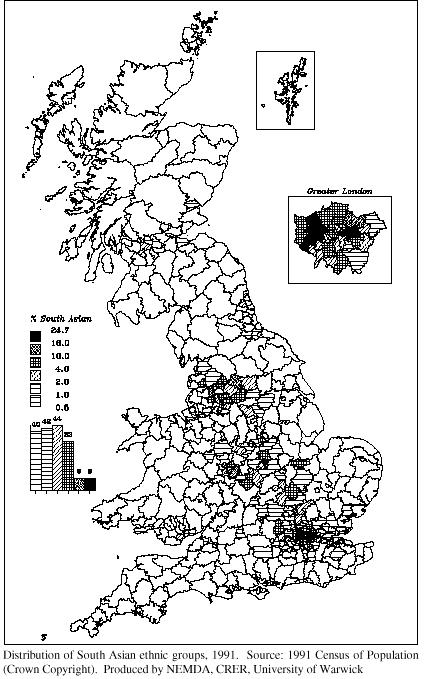
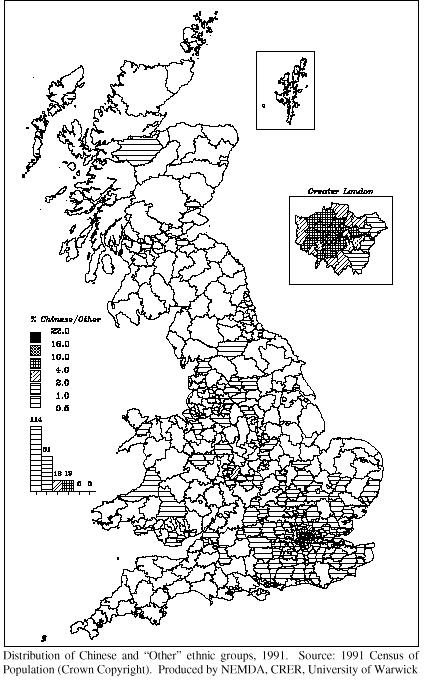
Maps of the geographical distribution of minority ethnic groups in Great Britain, 1991
These maps are based on data from the 1991 Census of Population. The geographical areas depicted are the 459 local authority districts which were defined following the 1974 local government re-organisation.
N.B. The "hyperlinks" on this page, and the pages you can reach from here, link to maps in Adobe Acrobat PDF format. These are more detailed versions of the small JPEG format maps on the right of this page. In order to view the PDF maps, you need to have an Adobe Acrobat reader installed on your computer. To save the PDF files to your local hard disk on a PC, hold down the 'shift' key while clicking on the link. On a Macintosh, hold down the 'alt' key while clicking on the link.
To go to the Adobe web-site, from where you can download the latest version of the Acrobat PDF reader,click on the icon below.
![]()
| Minority ethnic groups includes all ethnic groups other than white |
 |
| Black ethnic groups: includes Black-Caribbean, Black-African and Black-Other ethnic groups. For maps of individual Black ethnic groups, click here. |
 |
| South Asian ethnic groups : includes Indian, Pakistani and Bangladeshi ethnic groups. For maps of individual South Asian ethnic groups, click here. |
 |
| Chinese and "Other" ethnic groups: includes Chinese, Other-Asian and "Other-Other" ethnic groups. For maps of the Chinese, Other-Asian or "Other-Other" ethnic groups, click here. |
 |