Onset of Turbulence in Pipe Flow

More than 125 years ago Osborne Reynolds launched the quantitative study of turbulent transition as he sought to understand the conditions under which fluid flowing through a pipe would be laminar or turbulent1. Since laminar and turbulent flow have vastly different drag laws2, this question is as important now as it was in Reynolds' day.

Reynolds understood how one should define ``the real critical value'' for the fluid velocity beyond which turbulence will persist indefinitely3. He also appreciated the difficulty in obtaining this value. For years this critical Reynolds number, as we now call it, has been the subject of study, controversy, and uncertainty.

Now, more than a century after Reynolds pioneering work, we know that the onset of turbulence in shear flows is properly understood as a statistical phase transition4 5 6. How turbulence first develops in these flows is more closely related to the onset of an infectious disease than to, for example, the onset of oscillation in the flow past a cylinder or the onset of motion in a fluid layer heated from below.

Through the statistical analysis of large samples of individual decay and proliferation events, we at last have an accurate estimate of the real critical Reynolds number for the onset of turbulence in pipe flow7, and with it, an understanding of the nature of transitional turbulence.

The work is joint with: Kerstin Avila, David Moxey, Marc Avila, Alberto de Lozar, and Björn Hof


Determining the Critical Reynolds Number

At low Re turbulence occurs in localized patches known as puffs8. It is well established that puffs are metastable and decay with a characteristic time scale9. This time scale increases rapidly with Re, but does not diverge at finite Re10. This is not the full story however, as puffs may also split and generate new puffs11. Puff splitting also has a characteristic time scale which decreases with Re. The critical Reynolds number is determined as the point where these time scale are equal.
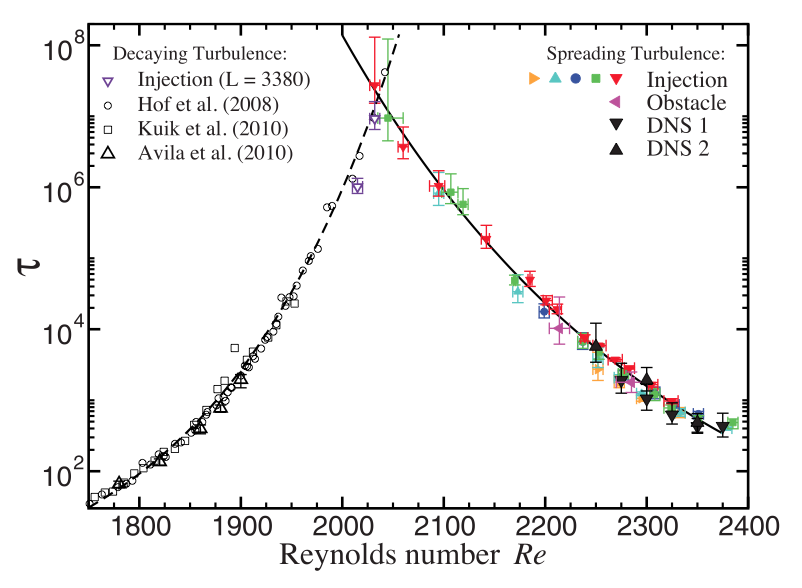

The figure on left shows time scales for decay and spreading turbulence as a function of Reynolds number. Data from both experiment and direct numerical simulation (DNS) are shown. The decay data on the left branch is primarily taken from past studies. The spreading times cales have been determined as part of the current study.

The experimental time scales of over 107 advective time units is achieved from more than 106 individual events in a pipe 4000 diameters long.


Below the critical Reynolds number 2040±10 the timescale for turbulent decay is shorter than the time scale for turbulence to spread. The decay of turbulent patches (puffs) outweighs their proliferation. Above the critical point, the opposite holds -- turbulent patches proliferate more quickly than they decay.


Onset of Sustained Turbulence

For Re larger than crossing point shown above, individual puffs are more likely to split than decay. In the absence of interactions between puffs, this would mark exactly the real critical Reynolds number for the onset of sustained turbulence. Correlations between decay and splitting events, due to the interaction between puffs, is expected to shift the real critical point slightly from the crossing point. At present the onset of sustained turbulence has not been directly measured in experiment or simulation. For this we rely on a model12 that reproduces decay and splitting of puffs in pipe flow.


The upper part of this figure shows the decay (green) and splitting (blue) time scales for model puffs. The model time scales behave qualitatively as those in real pipe flow, with a crossing at R×= 2040.

In the model the onset of sustained turbulence is directly accessible. In the lower figure the equilibrium turbulence fraction Ft is shown as a function of model Reynolds number R. Ft is the mean fraction of turbulence in the thermodynamic limit (mean over space, time, and ensemble, with length and time going to infinity).

The onset of sustained turbulence is continuous (in the directed percolation universality class) with a true critical value of Rc=2046.


From the model we see that the actual onset of sustained turbulence is within about 0.3% of the time-scale crossing. This difference is smaller than the error bars on the crossing point determined for real pipe flow. This strongly supports our determination of the real critical point for pipe flow.


1 O. Reynolds, Philos. Trans. R. Soc. London A 174, 935 (1883).
2 See for example the Moody Chart.
3 Ref. 1 pp. 957-958.
4 Y. Pomeau, Physica D 23, 3 (1986).
5 P. Manneville, Phys. Rev. E 79, 025301 (2009).
6 D. Moxey and D. Barkley, Proc. Natl. Acad. Sci. USA 107, 8091 (2010).
7 K. Avila, D. Moxey, A. de Lozar, M. Avila, D. Barkley, and B. Hof, Science 333, 192 (2011).
8 A. Darbyshire and T. Mullin, J. Fluid Mech. 289, 83 (1995).
9 M. Avila, A. P. Willis, and B. Hof, J. Fluid Mech. 646, 127 (2010).
10 B. Hof, J. Westerweel, T. M. Schneider, and B. Eckhardt, Nature 443, 59 (2006).
11 I. Wygnanski, M. Sokolov, and D. Friedman, J. Fluid Mech. 69, 283 (1975).
12 D. Barkley, Phys. Rev. E 84, 016309 (2011).